← Back to Home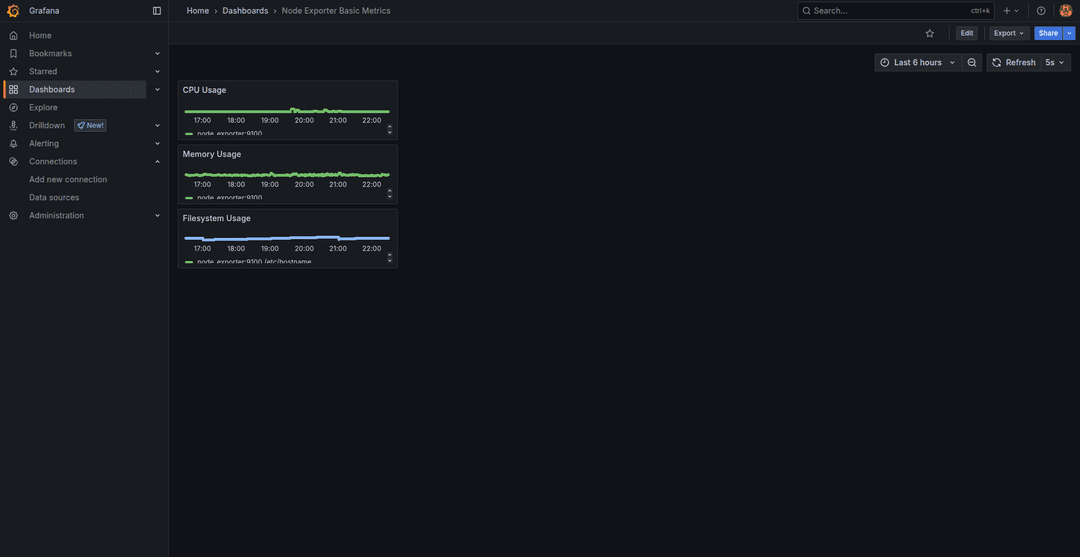
DevOps Portfolio Deployment with CI/CD & Monitoring
Tech Stack
Docker, GitHub Actions, Ansible, NGINX, Prometheus, Grafana, Ubuntu, Hetzner VPS, Let’s Encrypt, YAML, Bash
Project Goal
Deploy a production-ready portfolio application using DevOps best practices including automated provisioning, continuous deployment, and observability through a monitoring stack—all orchestrated with Infrastructure as Code and GitHub Actions.
Project Description
This project delivers a fully automated and observable deployment of a Next.js portfolio site (rcvb.info) onto a Hetzner VPS instance using:
- Ansible for server provisioning and configuration.
- Docker for containerized app and monitoring stack.
- GitHub Actions for CI/CD with centralized deployment control via repository_dispatch.
- NGINX as reverse proxy with automatic Let's Encrypt SSL.
- Prometheus + Grafana for system monitoring and metrics visualization.
Infrastructure Overview
Cloud Instance:
- VPS (Hetzner): Ubuntu 22.04, 2GB RAM, 40GB SSD, Public IP
- Domain: rcvb.info (configured via DNS for A/AAAA records)
Services Deployed via Docker Compose:
- App: Next.js web app
- NGINX: Reverse proxy with SSL (rcvb.info, grafana.rcvb.info)
- Prometheus: System metrics collector
- Node Exporter: Resource usage exporter
- Grafana: Dashboarding tool (accessible via subdomain)
Provisioning Logic (Ansible)
Playbooks & Roles:
- roles/web:
- Installs Docker and Docker Compose
- Configures system firewall and UFW rules
- Deploys the app container
- Sets up NGINX with domain config and SSL via Certbot
- roles/monitoring:
- Deploys Prometheus, Node Exporter, and Grafana containers
- Configures Prometheus scraping
- Sets up provisioning files and dashboards in Grafana
- Enables access to dashboards via subdomain (grafana.rcvb.info)
Templates:
- nginx.conf.j2: Unified config for multiple domains
- prometheus.yml.j2: Custom targets for scraping
- Grafana provisioning: datasources, dashboards.yaml, and JSON dashboards
CI/CD Pipeline (GitHub Actions)
- Monorepo Deployment: Repositories push deployment triggers to a central workflow repository https://github.com/rvbasulto/actions-workflows using repository_dispatch
- Main Actions:
- Build and push Docker image (on portfolio repo)
- SSH into VPS and pull latest image
- Restart containers via Ansible or raw SSH commands
Monitoring Stack
Prometheus:
- Configured with 15s scrape interval
- Scrapes node_exporter
Grafana:
- Default dashboard: Node Exporter Metrics
- Credentials and provisioning managed via mounted volumes
- Accessible at: https://grafana.rcvb.info
Outcomes
- DevOps Methodology End-to-End: Infrastructure provisioning, configuration management, CI/CD, and observability in a single project.
- Secure Public Deployment: Auto-renewing HTTPS, port exposure control via NGINX and firewall.
- Centralized Deployment Control: GitHub Actions repository handles deployment logic independently.
- Custom Monitoring: Live resource usage and container health accessible via Grafana dashboards.
- Reusable & Modular Codebase: Ansible roles, templates, and CI workflows structured for easy reuse or extension.